
GENERIC REGIME-INDEPENDENT PORTFOLIOS OF COMPLEMENTARY TRADING STRATEGIES
 Regime-independence of trading and/or investment strategy is the ultimate hard-to-achieve goal without any known universal solution. Success of the most well-known approaches of variance-reduction through diversification of trading strategies and financial instruments is often limited. Indeed, sole reliance on the diversity of financial instruments with too simplistic trading/rebalancing strategy is especially dangerous in critical market regimes due to increased correlation among otherwise diverse instruments. More sophisticated multi-strategy approach often has its own limitations since usually only best-on-average strategies are combined. Such strategies would exploit only those market regimes that lead to the best-on-average performance in the long run. As a consequence, many of these strategies could fail in less-frequent market regimes that are very different from the majority of the observed regimes. Therefore, while P&L volatility could be decreased by multi-strategy approach in the majority of the regimes, there could be significant downturns of the whole portfolio during rare or less-frequent regimes.
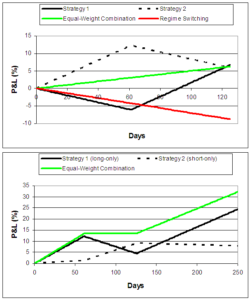
Obvious alternatives to static or quasi-static combination of multiple strategies include regime-switching approaches with strategy rotation according to the current market regime. Ideally such an approach could be very efficient since it is much easier to find individual strategies that are experts only in certain regimes than universal strategies with acceptable performance in multiple market regimes. However, accurate prediction of the regime change and timely strategy rotation is very difficult in the majority of practical cases. Therefore, aggressive and simplistic regime-switching could often lead to very unstable results with the performance inferior to the simple static combination of multiple strategies. This is schematically illustrated in the upper panel of the figure on the left (click to enlarge). Solid and dashed black lines represent cumulative P&L time series of the two strategies. Both of them generate ~5% profit over 6-month horizon. Static equal-weight combination of the two strategies will also generate the same profit with additional benefit of P&L volatility reduction (green line). However, if one invest full capital in strategy 1 and after 60 days switches full capital to strategy 2 using “natural” logic of taking capital from “losing” strategy and investing it in “winning” strategy, the final results will be ~10% loss (red line). Thus, strategy rotation based on simplistic regime-switching logic could lead to very unstable results.
Discovery of regime-independent multi-strategy ensembles in AQSCS multi-expert framework is based on very different principles. Our proprietary boosting-based optimization framework tries to find portfolio of base strategies with complementary performance in various market regimes which warranties regime independence of the overall portfolio. To address difficult less-frequent regimes, significant number of base strategies would not have attractive long-run performance but rather perform well in these difficult regimes, while have neutral performance (with small loss or small profit) in all other regimes. Thus, our ensemble combines both best-on-average strategies and many complementary strategies that could often remain unnoticed in other frameworks due to their less impressive individual performance over long horizons.
AQSCS principle is schematically illustrated with just 2 base strategies in the lower panel of the figure on the left (click to enlarge). Here long-only strategy with attractive long-run performance (solid black line) is combined with complementary short-only strategy (dashed black line) with the combined result shown as green line. Here less-impressive short-only strategy helps to reduce significant drawdown of the best-on-average strategy in the regime difficult for this main strategy. In contrast to simplistic and/or aggressive regime-switching approaches, here we use static boosting-generated weights for complementary strategies or slowly regime-adjusting weights if input-dependent boosting is used.
Regime-independence of trading and/or investment strategy is the ultimate hard-to-achieve goal without any known universal solution. Success of the most well-known approaches of variance-reduction through diversification of trading strategies and financial instruments is often limited. Indeed, sole reliance on the diversity of financial instruments with too simplistic trading/rebalancing strategy is especially dangerous in critical market regimes due to increased correlation among otherwise diverse instruments. More sophisticated multi-strategy approach often has its own limitations since usually only best-on-average strategies are combined. Such strategies would exploit only those market regimes that lead to the best-on-average performance in the long run. As a consequence, many of these strategies could fail in less-frequent market regimes that are very different from the majority of the observed regimes. Therefore, while P&L volatility could be decreased by multi-strategy approach in the majority of the regimes, there could be significant downturns of the whole portfolio during rare or less-frequent regimes.
Obvious alternatives to static or quasi-static combination of multiple strategies include regime-switching approaches with strategy rotation according to the current market regime. Ideally such an approach could be very efficient since it is much easier to find individual strategies that are experts only in certain regimes than universal strategies with acceptable performance in multiple market regimes. However, accurate prediction of the regime change and timely strategy rotation is very difficult in the majority of practical cases. Therefore, aggressive and simplistic regime-switching could often lead to very unstable results with the performance inferior to the simple static combination of multiple strategies. This is schematically illustrated in the upper panel of the figure on the left (click to enlarge). Solid and dashed black lines represent cumulative P&L time series of the two strategies. Both of them generate ~5% profit over 6-month horizon. Static equal-weight combination of the two strategies will also generate the same profit with additional benefit of P&L volatility reduction (green line). However, if one invest full capital in strategy 1 and after 60 days switches full capital to strategy 2 using “natural” logic of taking capital from “losing” strategy and investing it in “winning” strategy, the final results will be ~10% loss (red line). Thus, strategy rotation based on simplistic regime-switching logic could lead to very unstable results.
Discovery of regime-independent multi-strategy ensembles in AQSCS multi-expert framework is based on very different principles. Our proprietary boosting-based optimization framework tries to find portfolio of base strategies with complementary performance in various market regimes which warranties regime independence of the overall portfolio. To address difficult less-frequent regimes, significant number of base strategies would not have attractive long-run performance but rather perform well in these difficult regimes, while have neutral performance (with small loss or small profit) in all other regimes. Thus, our ensemble combines both best-on-average strategies and many complementary strategies that could often remain unnoticed in other frameworks due to their less impressive individual performance over long horizons.
AQSCS principle is schematically illustrated with just 2 base strategies in the lower panel of the figure on the left (click to enlarge). Here long-only strategy with attractive long-run performance (solid black line) is combined with complementary short-only strategy (dashed black line) with the combined result shown as green line. Here less-impressive short-only strategy helps to reduce significant drawdown of the best-on-average strategy in the regime difficult for this main strategy. In contrast to simplistic and/or aggressive regime-switching approaches, here we use static boosting-generated weights for complementary strategies or slowly regime-adjusting weights if input-dependent boosting is used. COMPLEXITY AND DISTANCE MEASURES OF INTRADAY MULTI-STRATEGY POSITIONS AS EARLY PREDICTORS OF MARKET REGIME CHANGES
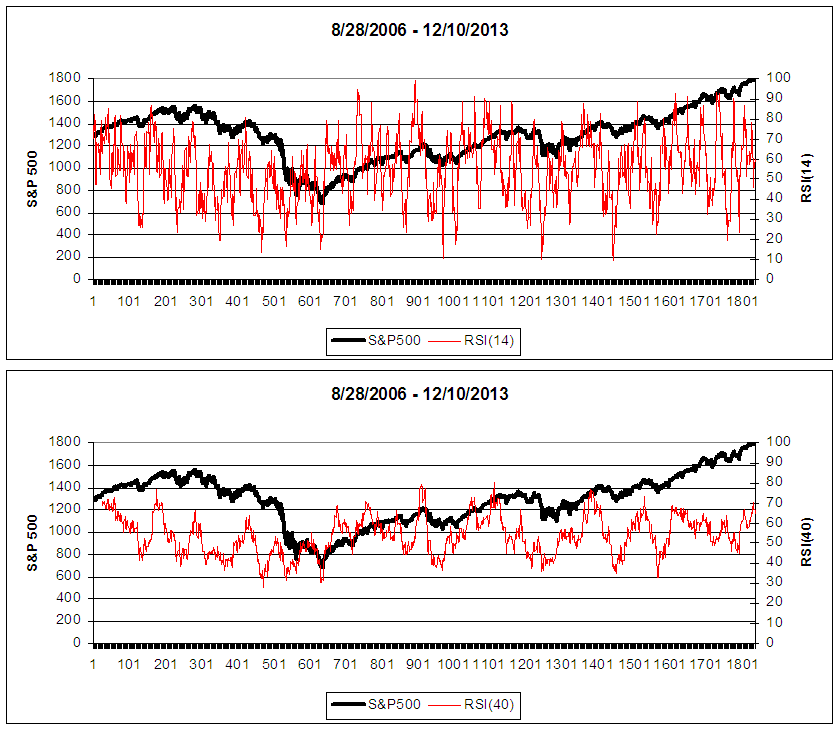
Accurate prediction of market regime changes is crucial for the majority of trading and investment strategies. While fundamental approaches could often foresee and explain the coming regime change, they are usually very inaccurate in actual market timing since it is strongly influenced by the hard-to-model behavioral component of the market participants. Technical indicators based on price/volume analysis could provide significantly better market timing since behavioral component is a part of price/volume dynamics. However, technical indicators have their own problems such as excessive noise and/or time delay in predicting important market events. This is illustrated in the figure on the left (click to enlarge). In the upper panel, we plot the well-known 14-day RSI oscillator computed from S&P500 time series (red line) and S&P500 index itself (black line). The lower panel presents RSI for longer, 40-day, period. It is clear that 14-day RSI is quite noisy. Although potentially it could be useful in detecting certain local market events, it cannot provide proper scaling of the anticipated regime changes and fails to give clear indication of the two major regime changes: 2008 market downturn and start of the current bull market. While, 40-day RSI is less noisy, it still cannot clearly separate local market events from the major regime changes. Other types of technical indicators such as variety of moving averages are also noisy on short averaging periods, have very significant delays for longer periods, and cannot provide timely prediction of the major regime changes.
 Price/volume data aggregates rational and pure behavioral activity of all market participants with different levels of expertise and prediction capabilities. Naturally, information encoded in price/volume data is noisy and requires filtering such as offered by typical technical indicators. However, although technical indicators could often show formal predictive power, even the best ones cannot directly offer consistent set of signals/rules for profitable trading. This also limits predictive capabilities of such indicators since they cannot directly assess behavioral changes of expert-level market participant which could be early precursors to major regime changes.
In contrast, our regime-independent portfolios of complementary strategies encode only tradable regimes and patters, while discarding other, potentially predictable, patterns which are useless for systematic profitable trading. Thus, such portfolio can be interpreted as a large pool of experts with complementary market knowledge. Unlike real physical experts, our ensemble offers full detailed information of expert (base strategy) behavior (their micro-timing, positions, etc) in different market regimes. The current market state can be represented as weighted position vector of all base strategies (experts) in the ensemble. An emerging change in the most recent set of such state vectors could be a robust and early precursor to the coming market regime switching.
One way to quantify changes in such position-based state vector is to compute weighted-averaged complexity of positions time series and observe change of such aggregated complexity measure over time. Time series analysis based on complexity measures is known to be efficient for state differentiation in biomedical and other applications (see AQSCS section on biomedical solutions). A significant complexity increase representing major change in the expert trading behavior would indicate upcoming change in the market regime. Illustration based on positions of one of our portfolios and Lempel-Ziv (LZ) complexity measure (computed over 40-day period) is presented in the figure on the left (click to enlarge). We see that two largest peaks in LZ measure (green circles) are clear precursors to major regime changes: downturn in 2008 and beginning of the current bull market. Changes of the more local nature could also be inferred from oscillatory LZ-complexity time series. Please note that utility of the direct calculation of complexity measures from price time series is often inconclusive for most practical purposes.
 An alternative approach to predict major regime changes from multi-expert state vectors is via the construction of minimum spanning tree (MST). We also find this approach to be effective for early detection of emerging physiological regimes in biomedical applications. First, we compute proximity matrix of consecutive position state vectors covering certain period (40-day period in our example). Proximity between each pair of state vectors is defined as Euclidean distance between the two vectors. Next, MST is constructed from such a matrix to reduce dimensionality and extract (filter) the most important information. Finally, time dependence of MST length is analyzed. The increase in MST length corresponding to appearance of new trading behavior would indicate upcoming market regime change. Illustration of MST approach is presented in the figure on the left (click to enlarge). Similar to LZ complexity indicator, two largest peaks in MST length (green circles) are clear precursors to major regime changes: downturn in 2008 and beginning of the current bull market.
 Aggregated complexity or MST length calculated from multi-expert position state vectors could be robust measure for early detection of significant regime changes. Another promising and intuitive way to utilize information encoded by position state vectors is template (pattern) matching. Template matching could be also applied directly to price time series or individual technical indicators but with limited success due to excessive noise and other reasons discussed above. The approach involves finding the closest matches in the history to the most recent period of market/instrument time series or a set of measures/indicators calculated from it. Once such historical matches are found, one can look at the immediate future after those historical periods to project possible future outcomes that would follow after currently observed period.
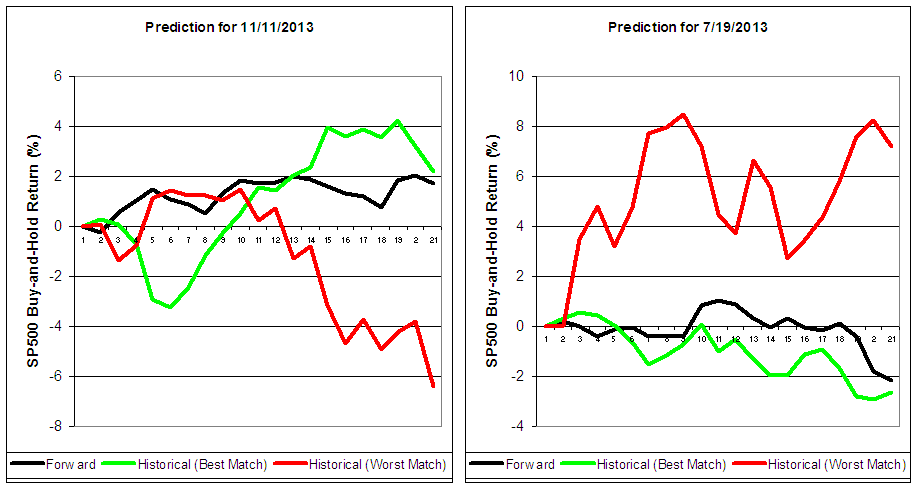
The first step in our template matching procedure is calculation of cross-proximity matrices of the current period with all historical periods of interests. Previously described MST procedure is dealing with proximity matrix based on all pairs of vectors from the current period. Here, cross-proximity matrix is obtained by calculating Euclidean distances between all position vectors from the current period and all vectors from the considered historical period of the same duration (20 days in our example). Next, MST is extracted from cross-proximity matrix and MST length is calculated. Finally, we choose historical periods with smallest MST length. Indeed, the lower is MST length the closer is historical period to the current period measured by multi-expert trading activity. Capabilities of the described approach are illustrated in the figure on the left (click to enlarge) for two of the 20-day periods in 2013. Black line represents 20-day buy-and-hold P&L time series of S&P500 immediately after the considered period. Similar time series that follow best-match (green line) and worst-match (red line) historical periods are also shown. It is clear that best-match historical time series is much closer to the considered period indicating predictive capabilities of this approach. Similarly, one could also project P&L time series of the particular strategy instead of just buy-and-hold index.
INTRADAY MULTI-STRATEGY POSITION STATE VECTORS AS UNIVERSAL DETECTORS OF RARE, EMERGING, AND HARD-TO-ANALYZE TRADABLE EVENTS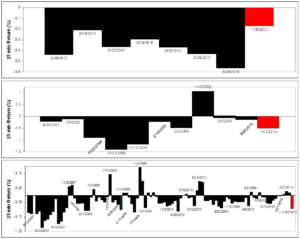
The relatively regime-independent performance of our multi-expert system for intraday trading suggests that base strategies (experts) are capable to exploit a wide variety of tradable intraday regimes and events with predictable patterns. The benefit of a direct automated usage of such system for trading is that all these details are hidden from the practitioner. However, to achieve the promised performance, one should start system on a daily basis with minimum or no discretional modifications, restrict trading to liquid instruments with high-enough intraday volatility, etc. Therefore, such a usage makes it impossible to employ this system for decision support in other strategies and investment/hedging decisions.
Nevertheless, there could be alternative benefits of using only certain tradable patterns as strategy-based indicators outside the full systematic trading procedure. The majority of encoded patterns would be frequently repeated and would have predictability for short-horizon (e.g., 10-40 min) returns significantly lower 100%. Obviously, such patterns could help generate regime-independent profit only by directly following systematic trading procedure. However, significant number of encoded regimes is characterized by less-frequent and even rare state patterns with predictability on the available historical data set close to 100%. Such “almost-sure” state patterns could be used for standalone rare-event trading or hedging of relevant strategies. It should be noted that the nature of such rare events/patterns makes it difficult or impossible to quantify them directly due to data limitations and lack of a priory intuition for the objective function choice.
In practice, a system exploiting such rare and “almost-sure” events could be implemented using template-matching framework which was already discussed above in a different context. In this case, we would take current multi-expert position state vector and calculate its Euclidean distance to all state vectors from the historical period of interest. Only those historical states that are “close-enough” to the current state according to application-specific threshold will be chosen. Next, distribution of the forward short-horizon returns corresponding to those historical states will be calculated. Examples for 3 different states in 2013 are presented in the figure on the left (click to enlarge). Here 25-min forward returns of S&P500 are presented by red bar for current state and by black bars for all historical states close to current state (tolerance 0.01). Upper and middle panels demonstrate rare or less-frequent states with almost sure profit for short position. Lower panel is an example of more frequent pattern which still has significant predictive power. Actual activation of the position based on the presented historical distribution should be decided by end user based on his objectives.
![]() BUSINESS INTELLIGENCE INDICATORS FOR EARLY PREDICTION OF REGIME CHANGES AND DETECTION OF RARE, EMERGING, AND HARD-TO-ANALYZE EVENTS
BUSINESS INTELLIGENCE INDICATORS FOR EARLY PREDICTION OF REGIME CHANGES AND DETECTION OF RARE, EMERGING, AND HARD-TO-ANALYZE EVENTS
To be done
To be done