

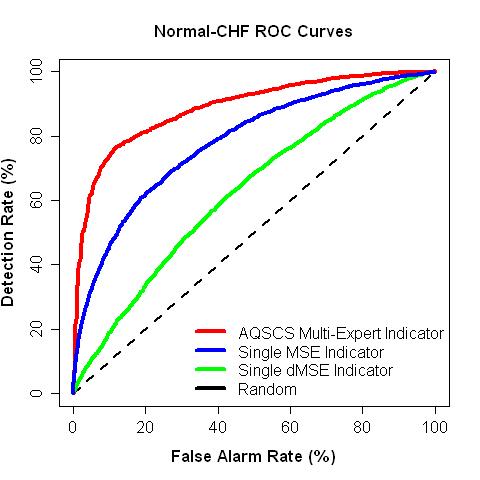
 PREVENTIVE EXPRESS DIAGNOSTICS OF COMPLEX, ASYMPTOMATIC, AND LIFE-THREATENING CARDIAC ABNORMALITIESSuperiority of the AQSCS multi-expert indicator for abnormality detection from short RR time series is demonstrated in the figure on the left (click to enlarge). As a practical example, congestive heart failure (CHF) is considered. CHF is very serious cariac abnormality that often lacks classical EKG signatures. It is clear from the figure that, for low levels of false alarm rates (<10-15%), detection rate of the AQSCS multi-expert indicator could be up to 40-50% higher than that of the typical single NLD indicator. Presented indicators are calculated on short, 256-beat, RR time series.
  Arrhythmia is very serious cardiac abnormality that could also accompany other cardiac pathologies. As shown in the figure on the left (click to enlarge), for low false alarm rates (<10-15%), arrhythmia detection rate of the AQSCS multi-expert indicator could be up to 40-50% higher than that of the typical single NLD indicator. Presented indicators are calculated on short, 256-beat, RR time series.
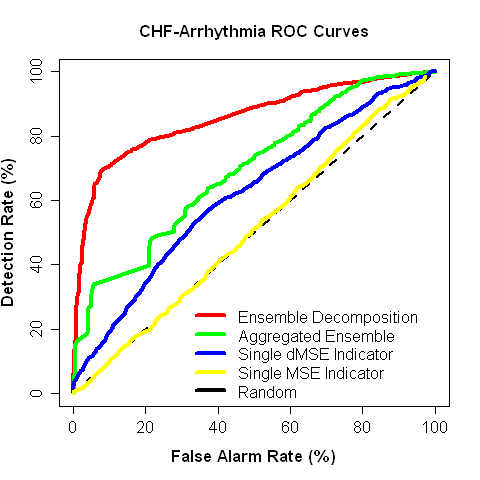
Indicators capable of detecting developing CHF and arrhythmia signatures during regular express diagnostic procedures could be of significant practical importance. For example, hypertrophic cardiomyopathy (HCM) is hard-to-detect cardiac disease that is a leading cause of sudden death in young athletes. Although different in nature, HCM shares common diagnostics features with CHF and is often accompanied by arrhythmias. Therefore, indicators capable of robust detection of CHF and arrhythmias may provide early warning signs of developing HCM and could be very useful for express diagnostics of athletes from short segments of RR data.
 UNIVERSAL INDICATORS FOR ROBUST DETECTION OF MULTIPLE ABNORMALITIES

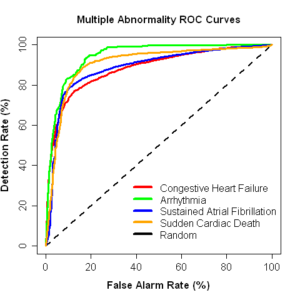
AQSCS multi-expert meta-indicators are universal in nature. Such multi-expert indicators are capable of detecting a wide range of different cardiac abnormalities as well as conditions with complex combination of different pathologies. ROC curves for one of such meta-indicators (in the figure on the left) demonstrate such universal capabilities. It is clear that for the acceptable false alarm rates (<20%), detection rates for a number of cardiac pathologies and complex abnormal conditions could be in the range of 80-100%. Presented AQSCS meta-indicator is calculated on short, 256-beat, RR time series.
ROBUST DETECTION OF EMERGING AND TRANSIENT ABNORMALITIES
ROC curves presented above demostrate advantages of AQSCS multi-expert measures over indicators based on single NLD measures. However, ROC curves cannot explicitely show how such advantages would be manifested in the real applications dealing with analysis of EKG time series. These applications include critical real-time analysis of the data collected by intensive care unit (ICU) equipment or portable wearable monitors as well as automated analysis of long time series collected by Holter monitors. Indicators for such critical analysis should demonstrate high detection rate of even short-lived or emerging abnormalities. To provide any practical utility, these indicators should also have low false alarm rate.
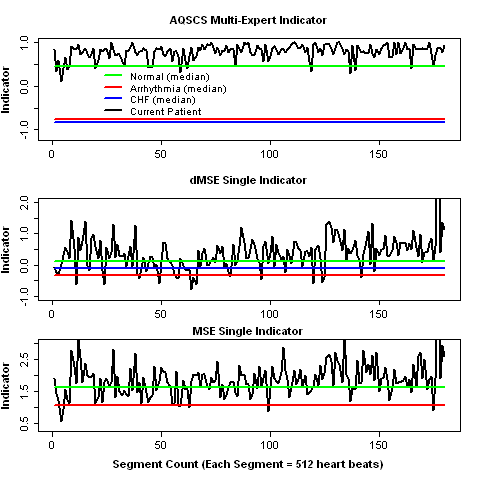
In the adjacent figure (click to enlarge), we plot indicator values computed from short consequitive RR segments of a single healthy person. Medians of indicator value distribution for population of normal (healthy) subjects as well as patients with CHF and arrhythmia are plotted as horizontal lines. It is clear that single NLD indicator values (two lower panels) are quite noisy and jumping from normal median to CHF/arrhythmia medians and back. This will result in high false alarm rates which critically diminishes practical utility of such indicators. In contrast, AQSCS multi-expert indicator (upper panel) is much less noisy and demonstrates significant stability by staying in the vicinity of normal median where it should be.

As discussed and illustrated in the above figure, AQSCS multi-expert approach can drastically reduce noise of individual HRV indicators computed from short RR segments. This makes possible detection of even short-lived and/or emerging abnormalities. Real-data illustration is provided in the figure on the left (click to enlarge), where 4 short 512-beat arrhythmia RR segments (labeled by red “A” letter) are inserted in the RR time series of the normal (healthy) subject. We see that both single HRV indicators (two lower panels) generate several false-alarm signals, i.e. distincly low indicator values where no arrhythmia is present. However, AQSCS multi-expert indicator (upper panel) clearly detects all arrhythmia events without any false alarm generation.
 Robustness of the AQSCS multi-expert indicator in detecting short lived and intermittent abnormalities is further ilustrated in the figure on the left (click to enlarge). Here 4 short arrhythmia RR segments (labeled by red “A” letter) with decreasing length (from 512-beat down to 128-beat) are inserted in the RR time series of the normal (healthy) subject. AQSCS multi-expert indicator clearly detects even the shortest arrhythmia events without any false alarm generation.
REAL-TIME PREDICTION OF ACUTE AND CRITICAL EVENTS

Reliable prediction of AF, spontaneous ventricular fibrillation (VF) and tachycardia (VT), and other acute cardiac events is very important for applications in smart pacers and defibrillators. This set of problems is more challenging than diagnostics or detection of slowly emerging abnormalities. Prediction of an acute event involves detection of subtle and transient precursors before the actual state change where effective data analysis could often be limited to short segments before the event. In addition, the amount of reliable data for real life-threatening events is often more limited compared to data for different pathologies or other persistent physiological conditions. However, our analysis indicates that AQSCS multi-expert classifier trained on multi-abnormality data could be an effective predictor of acute cardiac events. It can be used without any additional re-training on the limited data containing examples of such events.
As an example we consider application of AQSCS multi-expert indicator to data from patients with paroxysmal atrial fibrillation (PAF). Half of PAF records immediately precedes atrial fibrillation (AF) event (PAF_A) and the other half is taken far from any such event (PAF_N). In the figure above (click to enlarge), AQSCS meta-indicator outputs on all PAF_A and PAF_N 512-beat overlapping RR segments with different distances to AF event start are computed and averaged. It is clear that separation between these classes increases closer to AF event. Similar results are obtained for VT and VF event prediction using spontaneous ventricular tachyarrhythmia data 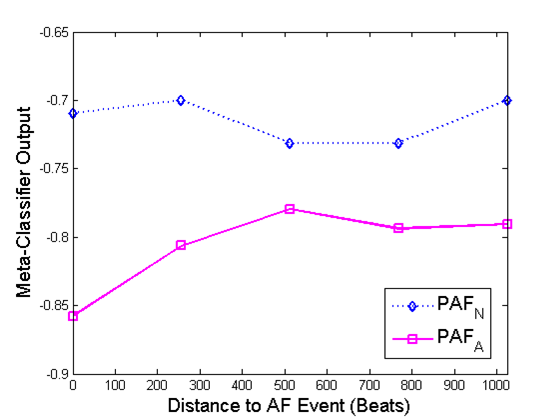
RARE PSYCHO-PHYSIOLOGICAL STATES AND PATHOLOGIES:
ROBUST DETECTION AND QUANTITATIVE DESCRIPTION

Diagnostics of complex and rare medical cases lacking clear symptoms of particular abnormalities is a very challenging problem. Case-based reasoning (CBR) is known to provide helpful and generic guidelines for the design of medical expert systems dealing with such non-standard diagnostic problems. Similarly, most practitioners implicitly follow case-based reasoning framework when they try to apply previously encountered cases to similar new situations.
Single-example learning (SEL) algorithms offer more formal machine learning framework for classification of rare and novel classes. SEL is a group of machine learning methods aimed at learning classifiers for novel classes by generalization from just one or a few training examples. Usually they use prior knowledge obtained previously while learning other classes from large databases.
However, both CBR and SEL approaches have serious limitations when applied to biomedical problems, the most important of which is requirement of a large number of examples of well-studied cases. In practice, data sets for well-defined abnormalities suited for quantification with existing indicators are often limited. However, significant amount of valuable clinical information from cases labeled only as normal or abnormal without particular diagnosis remains underutilized.
These coarsely classified data can be effectively employed to produce powerful normal-abnormal multi-expert classifiers. This is achieved by an optimal weighted combination of complementary indicators which are experts in different regimes of the considered biological complex system. Therefore, partial information of wide variety of dynamical regimes becomes implicitly encoded in the obtained ensemble of classifiers. However, only aggregated output is used for normal-abnormal classification, while the rich internal structure of the ensemble is completely ignored.
Extraction of this underutilized knowledge could be formalized in terms of ensemble decomposition learning (EDL)which was recently proposed by AQSCS team. Representation of complex and rare cases by the vector output of the ensemble of classifiers each element of which is an output of an individual classifier multiplied by its weight could prove to be more accurate and robust compared to significantly more coarse-grained representation typical for CBR and SEL approaches.
In the figure above, EDL application to real data is demonstrated. We show arrhythmia-CHF classification ROC curves for classifiers based on EDL, aggregated ensemble (classical ensemble approach), and single indicators. We see that, SEL-based approach in the EDL context is capable to construct quite accurate classifier for the two classes that are almost indistinguishable when standard aggregated ensemble output or single HRV indicators are used. It should be noted that presented SEL classifiers are based on just one reference example which suggests suitability of this approach for diagnostic of complex and rare cases characterized by extreme limitation of the available data.
PROFESSIONAL SPORT AND ACTIVE LIFESTYLE APPLICATIONS:
EXPRESS DIAGNOSTICS, OVERTRAINING DETECTION, AND QUANTITATIVE DESCRIPTION OF INDIVIDUAL ZONES OF OPTIMAL FUNCTIONING (IZOF)

Importance of systematic and objective psycho-physiological monitoring of athletes in professional sport constantly increases. Express medical diagnostics of emerging cardiac abnormalities, early detection of overtraining and similar negative changes in psycho-physiological state of athletes critically depend on the quality of such monitoring. Related challenging problem without existing universal solution is robust identification of the individual zones of optimal functioning (IZOF). Tuning an athlete into his/her own IZOF could dramatically improve stability of his/her performance and increase probability of the highest achievements. However, it is difficult to quantify such optimal zones.
Modern sport watches with ECG-type sensors and similar sensors working with smart phones can be used not only for programming personalized training sessions but also for simultaneous collection of beat-to-beat (RR) time series with accuracy comparable to clinical ECG equipment. Such personal RR data can be used for systematic heart rate variability (HRV) analysis to provide early indication of developing cardiac abnormalities, overtraining detection and for other purposes.
HRV-based indicators may offer fast and convenient detection of overtraining. This approach could provide an alternative for much less convenient and time-consuming psycho-physiological evaluations of overtraining currently adopted. However, individual HRV measures could often produce ambiguous results in practice. In contrast, quantification based on AQSCS multi-expert indicators could offer much more stable and practical solution. Moreover, AQSCS multi-expert framework can be also used for detection and quantification of optimal psycho-physiological states. The concept of IZOF introduced in sport psychology revealed multi-featured (multi-dimensional) nature of personal psycho-physiological states associated with the best performance.Therefore, while it is difficult to quantify such optimal zones using existing approaches, multi-component representation offered by AQSCS framework could be well-suited for this task.
Ability of AQSCS multi-expert measures to quantify psycho-physiological state changes are illustrated in the figure above. Here we analyzed RR data collected by Polar RS800 sport watch from one of the members of the “Rus’-Sport” rally team (Russian Federation). AQSCS multi-expert indicators (upper panel) and single NLD indicator (lower panel) are computed on short 256-beat RR segments. The analyzed states include: (1) base activity (sitting, standing, slow walk), (2) driving a car (regular home-office driving), (3) real rally training as co-pilot, and (4) running excersise. Distributions of a single indicator values are significantly overlapped which drastically reduces capabilities of discrimination among presented psycho-physiological regimes. On the other hand, AQSCS multi-expert measure provides clear and expected differentiation among these different states. Indeed, the number of stressful external events and associated emotional reactions is expected to be more during driving than in the base state. Even more such events and significant emotional reactions can occur during rally training. In accordance with this intuition, distribution of AQSCS multi-expert measure include more and more samples with lower indicator values and average indicator value shifts down. It is also known, that during physical excercise (e.g., running) mechanisms of HRV regulations are known to be quite different which causes HRV indicator shift towards “abnormal” range even for healthy subjects.
ROBUST QUANTITATIVE MONITORING IN PERSONAL WELLNESS AND PERSONALIZED MEDICINE APPLICATIONS
Unique capabilities of AQSCS multi-expert indicators could be effectively utilized in the emerging field of personalized medicine. Direct optimization of personal treatment based on genotype is not effective for abnormalities related simultaneously to multiple genes and influenced by history of non-genomic factors. Even more challenging is to personalize and objectively evaluate alternative therapies and relaxation techniques. For example, biofeedback have been shown to be effective not only in clinical settings but also in achieving optimal psycho-physiological states in professional sport and other areas. It is difficult to choose an optimal protocol since noticeable effects are hard to detect in early stages without robust quantitative indicators that are sensitive to small changes of psycho-physiological states. In general, early detection of subtle positive or negative changes caused by a particular treatment is a very important and challenging task in personalization and optimization of any medical treatment strategy.
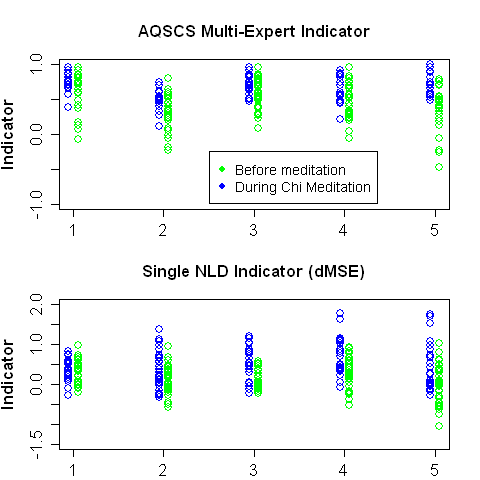
AQSCS multi-expert measures could effectively detect emerging as well as short-lived and intermittent changes of the physiological state. This capability is illustrated in the above figure, where physilogical states before and during Chi meditation are quantified by AQSCS multi-expert indicator (upper panel) and by single NLD measure (lower panel). For each subject, indicators are computed on several 256-beat RR segments. AQSCS meta-measure clearly shows the difference between “before” and “during” meditation states. On the other hand, single indicator values are significantly overlaping, making such distinction between two states much less obvious.
DIAGNOSTICS AND MONITORING OF NEURO-DEGENERATIVE DISEASES FROM GAIT DYNAMICS

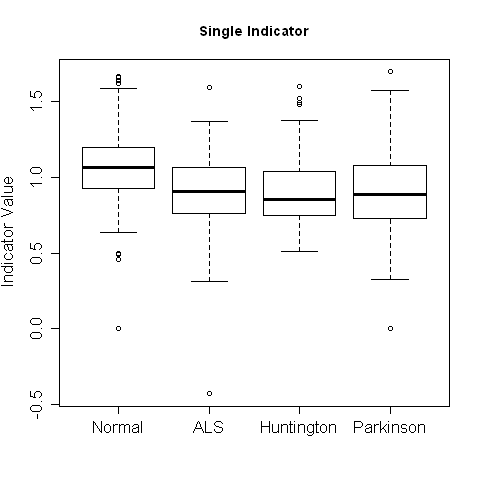 Variability metrics of gait stride intervals is known to be sensitive to changes in neurological functions associated with aging and development of certain neurological diseases. Majority of NLD measures and linear indicators used for variability analysis require long time series to achieve desired accuracy and stability. Accuracy and stability of such discrimination decreases when shorter segments of gait time series are used. For example, recommendation in one of the recent study is to use segment of at least 600 stride intervals for variability-based diagnostics. Nevertheless, indicators have to be computed on short segments in order to capture early signs of developing and/or intermittent abnormalities or to detect subtle initial effects of treatment procedures. Indeed, indicator computed on a long time series will average out these short-lived effects and will fail to detect them. As shown in the figure on the left (click on the figure to enlarge), single NLD indicator partially preserves its discrimination ability even on short 128-interval stride segments (median of healthy group is distinctly higher than those for groups with various abnormalities). However, there is significant overlapping between normal and abnormal groups. Therefore, normal/abnormal discrimination accuracy of a single measure is quite limited.
 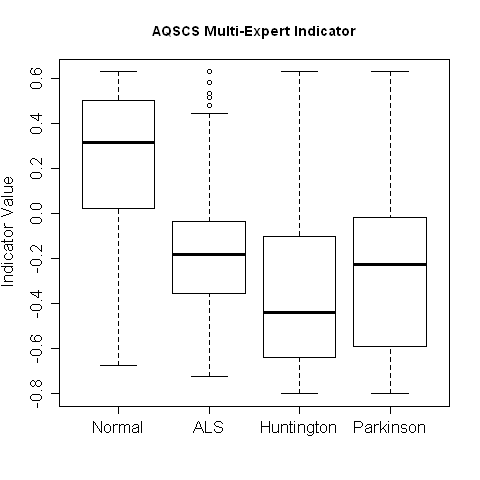 The reduced accuracy of single indicators may not be sufficient for many practical applications. However, optimal combination of complementary complexity measures discovered by AQSCS boosting-like algorithms can significantly increase accuracy and stability of indicators operating on short segments of gait time series. Such multi-complexity measures could be effective for early detection and monitoring of wide range of neurological abnormalities. As shown in the figure on the left, boosting-based combination of complexity measures could drastically increase accuracy of multi-expert classifier computed on 128-interval segments. Now, not only medians of ALS, PD, and HD groups are well below healthy group, but also all abnormal groups do not overlap with healthy group.
  A more formal comparison of the best single measure vs ensemble indicator is presented in the figure on the left (click on the figure to enlarge). Here we plot detection rates for 3 reasonable false alarm rates: 10%, 20%, and 30%. It is clear that boosting-based combination of individual complexity measures can increase detection rate by 30-50%. Such dramatic performance improvement suggests that AQSCS meta-indicators based on multiple complexity measures could be effective in early detection and monitoring of various neurological abnormalities.
 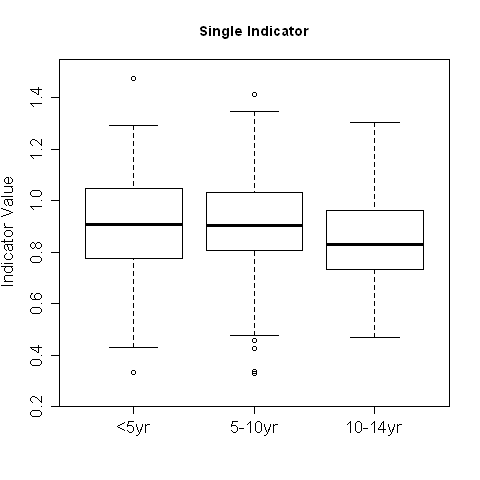 Early detection of emerging physiological state or slow regime changes is often more challenging than accurate diagnostics of the developed abnormality. Indeed, many discriminative features used in diagnostics are not yet present when abnormality is in early development stage. Similar challenges are also typical for early detection of changes during personalization of drug treatment or therapy. High detection rates with acceptable false alarm rates shown in the above figure illustrate ability of the multi-complexity meta-classifier to discriminate between gait time series from normal subjects and subjects with various developed abnormalities. Implicitly, this also suggests potential ability to detect early signs of the developing abnormality and other regime changes.
However, direct illustration based on data with emerging or intermittent pathologies could be more convincing. While we are not aware of any large open-access databases capturing slow development of neurological abnormalities, other gait databases can be used for illustration of slow physiological regime changes. One of them is gait maturation database from www.physionet.org. Gait maturation database is a collection of gait time series from 50 children of various age groups: from 3 to 14 years old. It is known that in very young children, immature control of posture and gait results in unsteady locomotion. In children about 3 years old, gait appears relatively mature. However, as it was suggested earlier that the dynamics of walking changes continues beyond this age.
It is interesting to compare capabilities of the best single indicator and AQSCS multi-complexity measure in detecting slow changes in gait maturation. phase. Figure on the left (click to enlarge) demonstrates that single indicator is not capable to detect any clear trend in gait dynamics evolution as children age increases.
Early detection of emerging physiological state or slow regime changes is often more challenging than accurate diagnostics of the developed abnormality. Indeed, many discriminative features used in diagnostics are not yet present when abnormality is in early development stage. Similar challenges are also typical for early detection of changes during personalization of drug treatment or therapy. High detection rates with acceptable false alarm rates shown in the above figure illustrate ability of the multi-complexity meta-classifier to discriminate between gait time series from normal subjects and subjects with various developed abnormalities. Implicitly, this also suggests potential ability to detect early signs of the developing abnormality and other regime changes.
However, direct illustration based on data with emerging or intermittent pathologies could be more convincing. While we are not aware of any large open-access databases capturing slow development of neurological abnormalities, other gait databases can be used for illustration of slow physiological regime changes. One of them is gait maturation database from www.physionet.org. Gait maturation database is a collection of gait time series from 50 children of various age groups: from 3 to 14 years old. It is known that in very young children, immature control of posture and gait results in unsteady locomotion. In children about 3 years old, gait appears relatively mature. However, as it was suggested earlier that the dynamics of walking changes continues beyond this age.
It is interesting to compare capabilities of the best single indicator and AQSCS multi-complexity measure in detecting slow changes in gait maturation. phase. Figure on the left (click to enlarge) demonstrates that single indicator is not capable to detect any clear trend in gait dynamics evolution as children age increases.  On the other hand, as evident from figure on the left (click to enlarge), aggregated output of the AQSCS multi-complexity ensemble indicator shows clear trend towards gait dynamics of healthy adults as age increases. Remember that the range of probability-like output is between -1 and +1, with healthy state corresponding to positive numbers. Therefore, aggregated output of multicomplexity ensemble measures could be a promising metrics for early detection of subtle and/or slow changes in gait dynamics.
REMOTE BIOMETRICS BASED ON GAIT DYNAMICS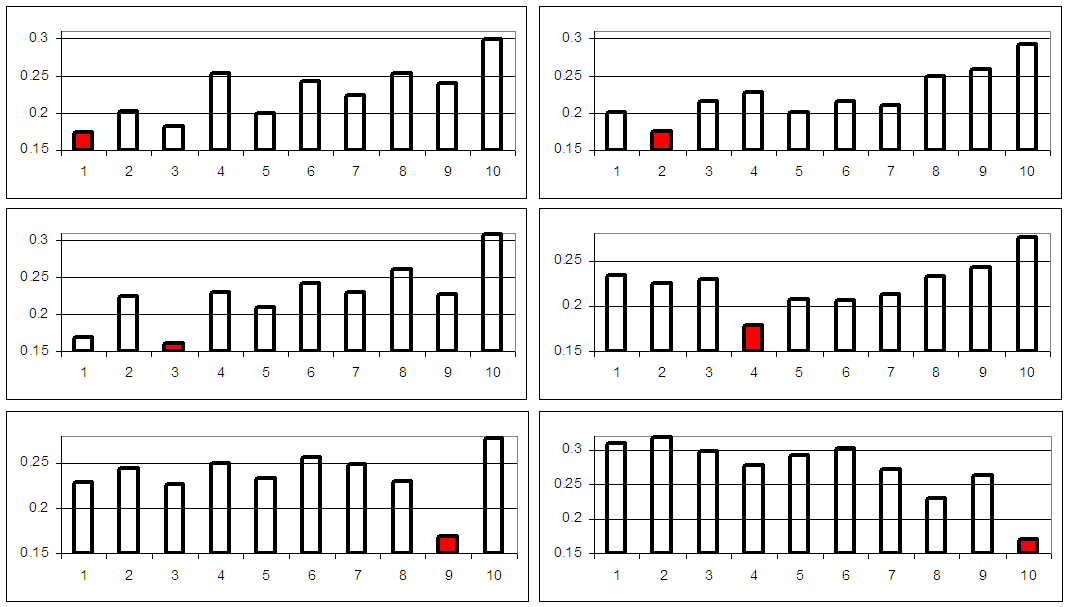
Recently, gait recognition has become a topic of interest within the computer vision applications, due to its growing importance as a biometric modality. Considerable research efforts are being devoted to characterize and extract gait dynamics automatically from video. Biometric systems for human identification at a distance are in increasing demand in various real-life applications. Many biometric modalities such as face recognition, iris, fingerprints, palm prints, and hand geometry suffer from two main disadvantages: (1) high failure rate when only low resolution images and pictures taken at a distance are available, and (2) necessity of subject cooperation for accurate results. For these reasons, innovative biometric recognition methods for human identification at a distance have significant potential and appeal for surveillance and forensic applications.
Most of existing approaches require significant amount of details to be extracted from sequential video images. Unfortunately, in many practical cases the quality of available video may be poor due to insufficient lighting, covering of motion details by cloth, and other reasons. In such circumstances, one of the gait characteristics that could still be extracted is time period between consecutive steps.
Therefore, AQSCS multi-complexity ensemble measures for gait time series analysis could be potentially employed as complementary approach in biometric applications, especially in cases where quality of the video prohibits usage of more traditional techniques. Besides remote gait-based biometrics from video sequences, gait recognition from accelerometer data, that are currently available in all standard smartphones and other wearable devices, becomes comparably important. Indeed, remote acquisition of accelerometer time series could be used to identify the person currently carrying the phone and in related applications. Again, AQSCS multi-complexity measures could be applicable to this set of gait-based biometric problems.
Our initial results indicate that AQSCS multi-complexity ensemble measures could differentiate between different individuals using their stride interval time series. This suggests applicability of our approach to gait-based biometrics problems discussed above. Our conclusions are based on the analysis of gait time series from 10 healthy subjects available at http://www.physionet.org and from our proprietary data sets.
 MULTI-TYPE COMPLEXITY INDICATORS FOR DIAGNOSTICS AND REAL-TIME PREDICTION
To be done
To be done

MULTI-TYPE COMPLEXITY INDICATORS FOR DIAGNOSTICS
To be done
To be done
 MULTI-TYPE COMPLEXITY ANALYSIS OF CODING AND NONCODING DNA SEQUENCIES
To be done
To be done

MULTI-TYPE SPATIAL COMPLEXITY INDICATORS FOR DIAGNOSTICS
To be done
To be done